
10 February 2025
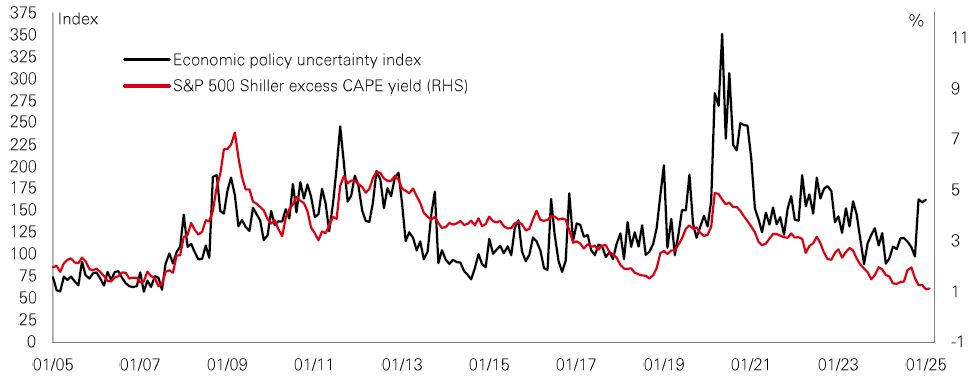
Quantitative measures of global policy uncertainty are increasing. Last week, like in the last few weeks, investors had to deal with another burst of episodic volatility in markets.
Global stocks weakened, reflecting how policy uncertainty can be a challenge to profits and how it prompts more risk aversion. While, in government bonds, there was a “flattening” of the yield curve (see further details on page 2), as markets reflected the possibility of bumpier disinflation.
Meanwhile, the US dollar remained a safe harbour, strengthening as policy uncertainty increased. But after being a serial winner in FX markets, investors are beginning to question whether “King dollar” can keep the crown? After all, the dollar is expensive, the Fed is still cutting rates in 2025, and US fiscal deficits are very wide. Investors need to consider the possibility that further dollar strength may be temporary.
Another telling sign of risk aversion in markets was the rally in the gold price. Gold has been on a tear over the past 12 months. The recent rise in policy uncertainty has seen that trend continue.
Overall, the latest bout of volatility – the third this year after the surge in bond yields and the AI trade wobble during January – reinforces that markets will face a volatile ride at times in 2025, albeit against a broadly constructive backdrop of no recession, further rate cuts and resilient profits. This is called “volatile Goldilocks”.
With bouts of volatility proving to be a feature of markets this year, diversification strategies are front of mind for asset allocators. After a strong performance in 2024, one asset class that could be ideally placed to keep delivering in these conditions is hedge funds.
Hedge funds have a track record of outperforming global balanced portfolios during spells of particularly high volatility. Moreover, when you combine them into well-diversified portfolios of different strategies, their own volatility profile compares well against traditional assets. In fact, with recent volatility notably affecting cryptocurrencies, hedge funds also offer potentially more resilience than non-traditional, crypto diversifiers.
Crucially, hedge fund strategies can profit from volatility in a range of ways, including long and short positioning, and arbitrage opportunities. Against a backdrop of higher levels of uncertainty, they have new opportunities to feed off the associated volatility. For 2025, rising uncertainty and market volatility are likely to play to the strengths of hedge funds, providing a potential boost to returns, as well as a degree of downside protection.
The value of investments and any income from them can go down as well as up and investors may not get back the amount originally invested. Past performance does not predict future returns. For informational purposes only and should not be construed as a recommendation to invest in the specific country, product, strategy, sector, or security. Any views expressed were held at the time of preparation and are subject to change without notice. Any forecast, projection or target where provided is indicative only and is not guaranteed in any way. Source: HSBC Asset Management. Macrobond, Bloomberg. Data as at 7.30am UK time 07 February 2025.
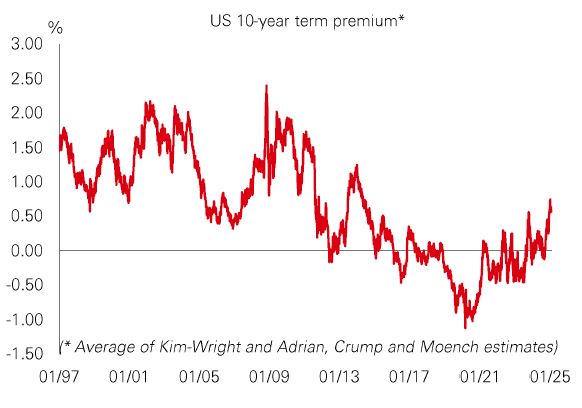
The yield curve has flattened by around 20bp since the US 10-year yield peaked in mid-January. However, some analysts continue to think the trend is towards a “structural steepening”. The prospect of further gradual Fed easing should put downward pressure on the two-year yield while further declines in the 10-year yield are likely to be limited by two key factors. First, US government debt is high and rising, and the situation is unlikely to change anytime soon. Second, a more fragmented geopolitical and international trade backdrop implies greater inflation volatility. The term premium on US Treasuries could, therefore, trend higher as investors require greater compensation for holding longer dated debt, leading to a gradual steepening of the curve. Moreover, should growth disappoint, and the Fed eases policy aggressively, the curve would steepen rapidly. |
Where this view could go wrong is if the Fed were forced to hike the funds rate. However, the bar for this to happen is quite high given Chair Powell views policy as “meaningfully restrictive” and the FOMC does not want labour markets to “cool off anymore”.
US earnings season approached half-way last week, with some of the S&P 500’s big technology names reporting figures for Q4 2024. After the recent ‘AI trade’ wobble, the outlook for tech profits has been under the microscope – particularly given the sector’s high valuations. Some ‘Magnificent Seven’ stock prices have been punished on marginal profit misses, high capex spending, and disappointing forward guidance. In terms of year-on-year Q4 profit growth, Financials are leading the index, with Communications Services and Technology also beating expectations. Among the growth laggards have been Industrials, Energy, and Materials. |
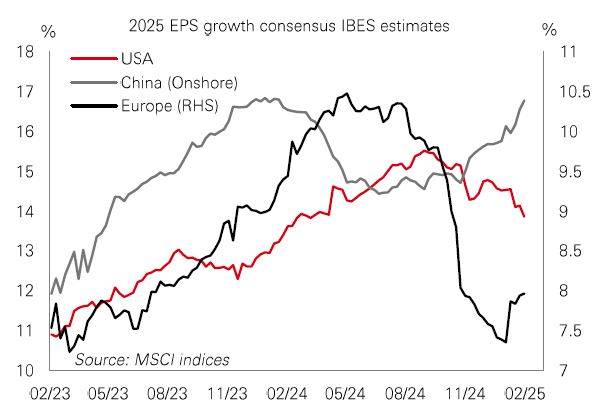
While the profits growth outlook is solid for the US, there have been downward revisions to 2025 consensus expectations recently. By contrast, Europe and China, which both saw a deterioration in the profit growth outlook last year, have seen revisions pick-up for 2025. This is evidence of profit growth potentially broadening beyond the US to markets that are significantly cheaper. In Europe, weak sentiment has set a low bar for positive surprises. While in China, further policy stimulus this year could herald a performance pick-up.
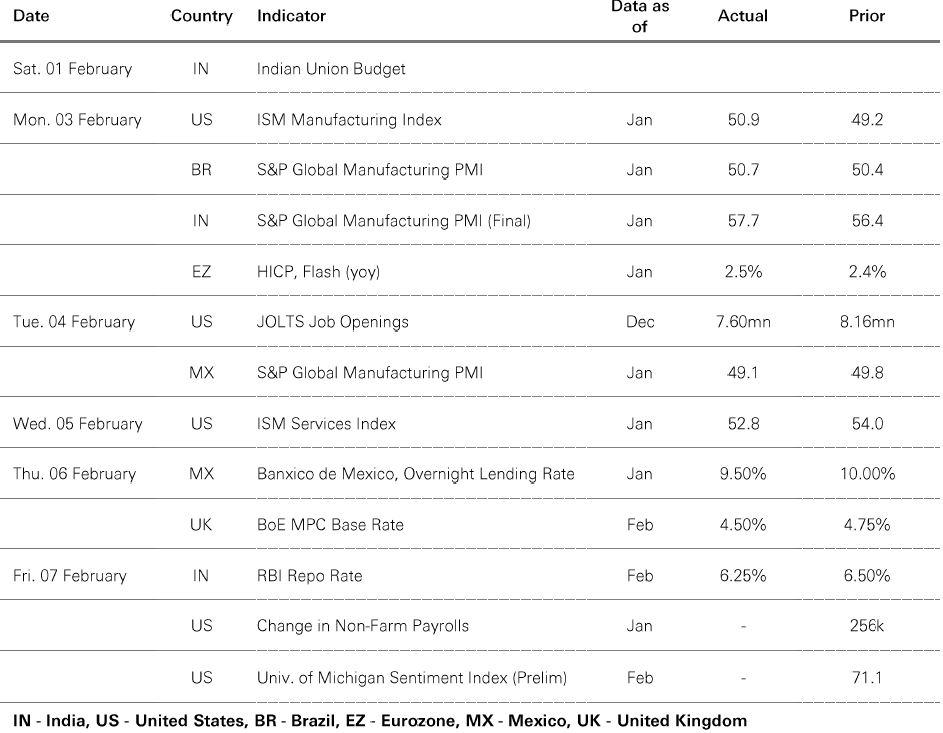
India’s recent FY2025-2026 Union Budget endeavoured to strike a balance between boosting growth, maintaining capex spending, and sticking to a path of fiscal restraint. India experienced a cyclical slowdown last year, so a key budget pivot was an income tax cut to encourage consumer spending. Meanwhile, capex spending on road and rail is set to remain flat, with marginal growth in other sectors. And as for the fiscal deficit, the reduction target for FY25-26 is 4.4% versus 4.8% in FY24-25. |
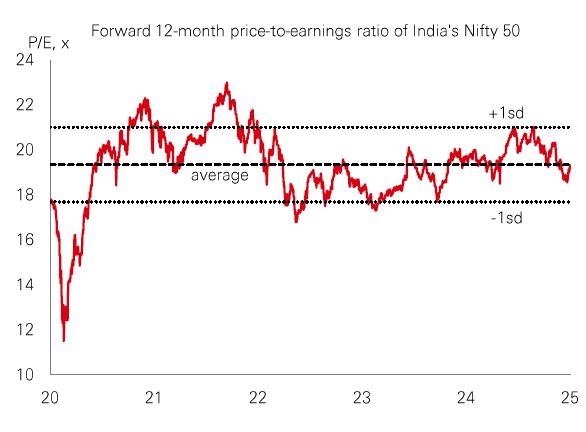
In response, consumer stocks rallied, while some railway, industrial and capex-sensitive plays corrected. Indian stocks have weakened since their peak last September, and CY24 earnings expectations have fallen by 3%. With an easing in frothy valuations, the large-cap Nifty 50 index now trades at a forward price-to-earnings ratio of 19.3x, which is around its five-year average. However, major sectors (excluding financials) are still trading at a premium and could be vulnerable to any macro or profit disappointments amid elevated short-term expectations. Active stock selection remains crucial.
Past performance does not predict future returns. The level of yield is not guaranteed and may rise or fall in the future. For informational purposes only and should not be construed as a recommendation to invest in the specific country, product, strategy, sector, or security. Any views expressed were held at the time of preparation and are subject to change without notice. Any forecast, projection or target where provided is indicative only and is not guaranteed in any way. Index returns assume reinvestment of all distributions and do not reflect fees or expenses. Source: HSBC Asset Management. Macrobond, Bloomberg, Datastream. Data as at 7.30am UK time 07 February 2025.
Source: HSBC Asset Management. Data as at 7.30am UK time 07 February 2025. For informational purposes only and should not be construed as a recommendation to invest in the specific country, product, strategy, sector or security. Any views expressed were held at the time of preparation and are subject to change without notice.
Rising global policy uncertainty cast a pall over risk markets last week. While the US dollar index consolidated, core government bonds rallied in response to some weaker-than-expected US macro prints, with eurozone bonds and UK Gilts slightly outperforming US Treasuries. The BoE lowered rates by 0.25%, with two members calling for a 0.50% reduction. In the stock markets, US equities reversed early losses last week, benefitting from lower US bond yields. The Euro Stoxx 50 index recorded stronger gains following a wave of upbeat earnings, while Japan’s Nikkei 225 ended lower amid investor caution over external uncertainties and a firmer yen against the US dollar. Other Asian stocks mostly performed well, with Hong Kong’s Hang Seng and mainland China’s Shanghai Composite posting catch-up rallies after the Lunar New Year holiday. In commodities, oil fell, whereas gold and copper both rose.


We’re not trying to sell you any products or services, we’re just sharing information. This information isn’t tailored for you. It’s important you consider a range of factors when making investment decisions, and if you need help, speak to a financial adviser.
As with all investments, historical data shouldn’t be taken as an indication of future performance. We can’t be held responsible for any financial decisions you make because of this information. Investing comes with risks, and there’s a chance you might not get back as much as you put in.
This document provides you with information about markets or economic events. We use publicly available information, which we believe is reliable but we haven’t verified the information so we can’t guarantee its accuracy.
This document belongs to HSBC. You shouldn’t copy, store or share any information in it unless you have written permission from us.
We’ll never share this document in a country where it’s illegal.
This document is prepared by, or on behalf of, HSBC UK Bank Plc, which is owned by HSBC Holdings plc. HSBC’s corporate address is 1 Centenary Square, Birmingham BI IHQ United Kingdom. HSBC UK is governed by the laws of England and Wales. We’re authorised by the Prudential Regulation Authority (PRA) and regulated by the Financial Conduct Authority (FCA) and the PRA. Our firm reference number is 765112 and our company registration number is 9928412.


