
25 November 2024
Over the previous week, risk markets have paused for breath. US stocks have unwound some of their big post-election gains, high-yield credit spreads have picked up from multi-year lows, and commodity prices have lost ground.
We think recent market action reflects a new reality facing investors. There is a “tug of war” between enthusiasm around significant aspects of the US policy outlook – mainly deregulation and tax cuts – versus concerns about the potentially stagflationary effects of loose fiscal policy and an acceleration of the trend in US isolationism.
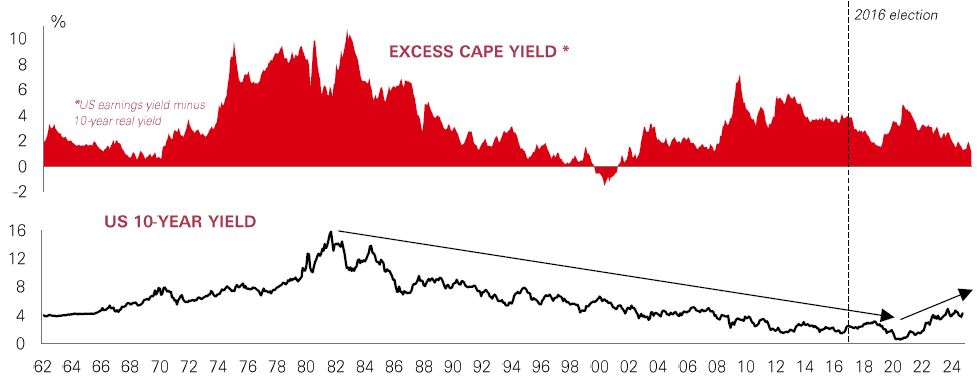
US 10-year yields are hovering just below April’s year-to-date highs despite the Fed now in easing mode and inflation in a holding pattern, with room for more disinflation in 2025. This is because there is now much greater uncertainty around the inflation outlook, reflected in the recent pick-up in the US term premium.
Structurally higher inflation and interest rates pose many challenges for investment markets. It weighs on the growth and earnings outlook. And it makes stock valuations less attractive versus bonds. The most expensive parts of the stock market such as US mega-cap tech – which look priced for perfection – could be vulnerable.
Four years after being badly hit by Covid travel restrictions, air traffic has finally caught up with 2019 levels – but the global aviation industry’s cyclical and structural growth drivers are changing.
A new research explores the sector’s investment outlook – with a focus on airports, which are a key part of the infrastructure asset class. Overall demand looks robust, but new trends in the traveller ‘mix’ and geographic growth are emerging. While business travel continues to decline, demand from cohorts travelling for leisure and ‘visiting friends and relatives’ is growing quickly. And in terms of regional demand, industry forecasts suggest that fast-growing developing nations will contribute 85% of the industry’s growth over the next 20 years – with Asia Pacific expected to be a powerhouse.
For airport investors, post-pandemic challenges are giving way to new opportunities, with wealth and demographic trends expected to drive above-GDP growth rates for the industry. Together with offering a wider range of travel destinations, there are opportunities for airports to enhance returns with a wider range of premium services.
The value of investments and any income from them can go down as well as up and investors may not get back the amount originally invested. Past performance does not predict future returns. Investments in emerging markets are by their nature higher risk and potentially more volatile than those inherent in some established markets. The level of yield is not guaranteed and may rise or fall in the future. For informational purposes only and should not be construed as a recommendation to invest in the specific country, product, strategy, sector or security. Any views expressed were held at the time of preparation and are subject to change without notice. Any forecast, projection or target where provided is indicative only and not guaranteed in any way. Diversification does not ensure a profit or protect against loss.
Source: HSBC Asset Management. Macrobond, Bloomberg. Data as at 7.30am UK time 22 November 2024.
With Q3 earnings season drawing to a close in the US, last week saw results from the market’s most closely-watched technology giant, NVIDIA. Like the rest of the S&P 500’s ‘Magnificent 7’ tech stocks, NVIDIA’s quarterly profits were ahead of analyst forecasts for the quarter. Indeed, with more than 90% of companies in the index having reported, around 75% of them have beaten profit expectations.
However, the scale of index-wide profits beats – averaging about 4.3% above estimates, according to Factset – is roughly half that of their 5-year average. Firms may be finding it harder to beat forecasts. And given the index trades on a price-to-earnings ratio of 22.3x (versus its 15-year average of 16.4x), prices could be vulnerable if future earnings disappoint. The communication services, IT and healthcare sectors have seen the largest (aggregate) beats, while energy and materials have seen the largest (aggregate) misses.
From here, profit growth expectations remain high into 2025. But against a backdrop of policy uncertainty and a cooling economy, any weakness could lead to heightened volatility.
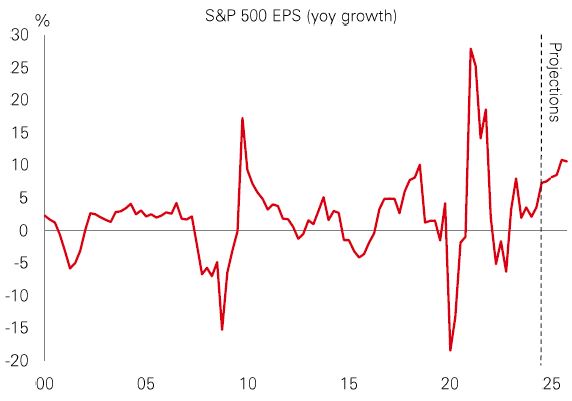
US stock buybacks have boomed in recent years as companies looked to boost earnings-per-share, buoy their valuations, and allocate cash to reward shareholders. Against a backdrop of falling rates – dampening returns on cash holdings – this popularity should persist. But this isn’t just a US phenomenon – Asia stock markets have seen a buyback boost too.
A key difference in Asia is that buybacks have been driven by regional efforts to improve corporate governance. Governments have called on firms to be more investor-friendly and improve their valuations. Japan is a prime example, and is now seeing a third consecutive year of record buybacks in 2024. A similar move in South Korea – the ‘Value-Up’ programme – saw a 25% rise in buybacks in H1-24 from H1-23. Mainland Chinese authorities have also demanded action on profitability and shareholder returns. Share repurchases there are on course to break domestic records this year, with September’s stimulus measures including a RMB300bn relending facility earmarked specifically for share buybacks. With Asian markets on undemanding valuations, further progress on corporate reforms and share buybacks could provide upside.
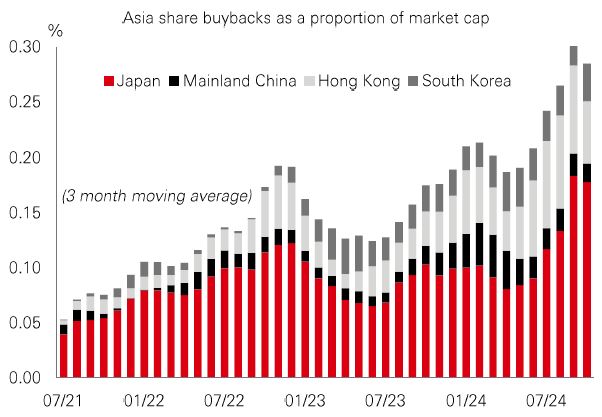
Recent action with the US dollar looks to be following the 2016 playbook. The DXY index or “dixie” is up around 3-4% since the US election, about the same as in the 15 days following the 2016 poll.
But moves in individual FX pairs show some interesting differences versus the 2016 experience. The most striking contrast is the Mexican peso. This was one of 2016’s biggest casualties, and although it’s down this time around, it is one of the better performers. Other Latin American currencies have held up well too – the Brazilian real and Columbian peso have hardly budged. This resilience could reflect a hawkish tilt to central bank policymaking in the region in recent months.
Moves in Europe have also been quite different. The euro and some Eastern European currencies have been badly hit by the election result. Trade tariffs would come at a very difficult time for the region’s manufacturers. But the good news is FX weakness supports external competitiveness for export-dependent firms. In 2025, US-specific factors – policy and inflation trends – are likely to be a big influence on the dollar. But global economic and political developments will also be key.
Past performance does not predict future returns. The level of yield is not guaranteed and may rise or fall in the future. For informational purposes only and should not be construed as a recommendation to invest in the specific country, product, strategy, sector or security. Any views expressed were held at the time of preparation and are subject to change without notice.
Source: HSBC Asset Management. Macrobond, Bloomberg, Datastream. Data as at 7.30am UK time 22 November 2024.
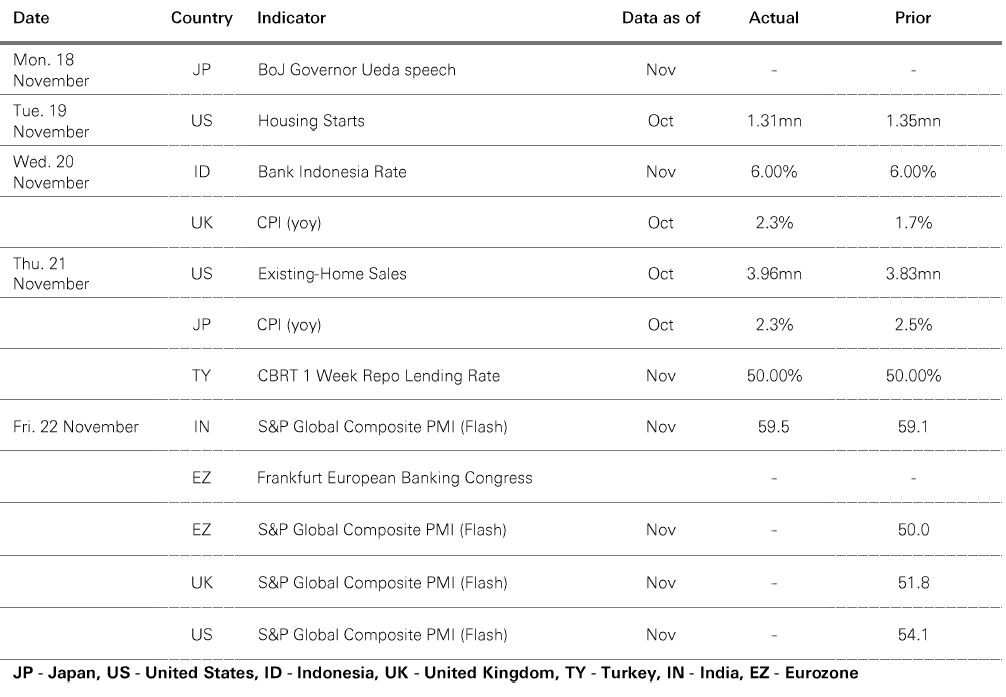
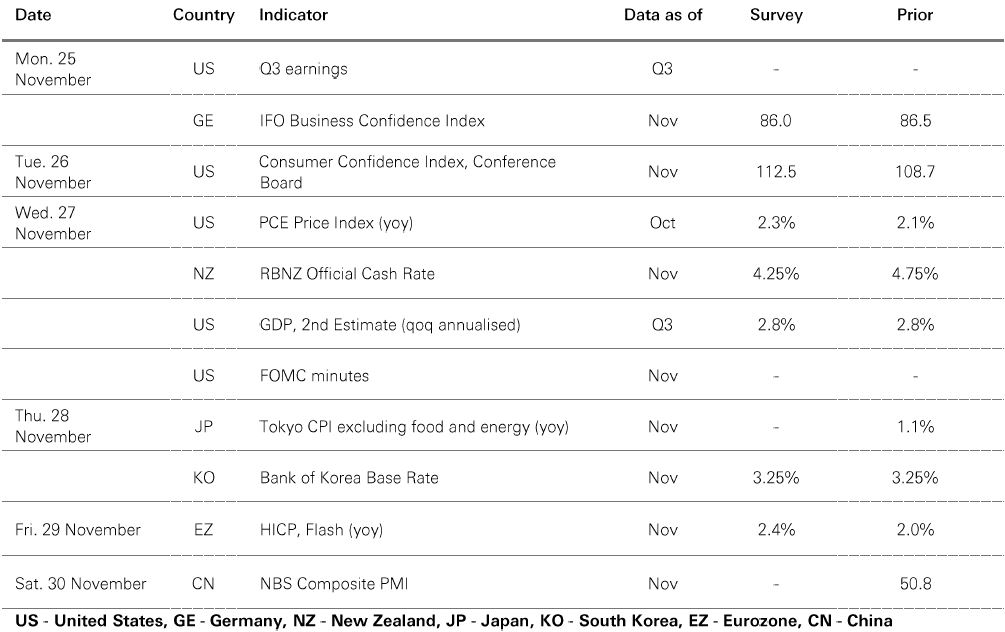
Source: HSBC Asset Management. Data as at 7.30am UK time 22 November 2024. For informational purposes only and should not be construed as a recommendation to invest in the specific country, product, strategy, sector or security. Any views expressed were held at the time of preparation and are subject to change without notice.
Risk markets were resilient despite heightened geopolitical tensions, with both oil and gold prices rallying. The US DXY dollar index paused for breath after its recent strong run. Core government bonds consolidated ahead of key US inflation data and mixed comments from Fed officials. US equities saw a broad-based rally as investors digested Q3 earnings. The Euro Stoxx index fell modestly, while Japan’s Nikkei 225 weakened as the yen rebounded versus the US dollar. BoJ governor Ueda reiterated his commitment to gradual rate hikes. Emerging market stock markets were mixed. The Shanghai Composite and Hang Seng indices finished the week lower, but the tech-driven South Korea Kospi index performed well. India’s Sensex index fell further. In Latin America, Brazil’s Bovespa and Mexico’s IPC equity indices were on the defensive. Meanwhile, copper was little changed.


We’re not trying to sell you any products or services, we’re just sharing information. This information isn’t tailored for you. It’s important you consider a range of factors when making investment decisions, and if you need help, speak to a financial adviser.
As with all investments, historical data shouldn’t be taken as an indication of future performance. We can’t be held responsible for any financial decisions you make because of this information. Investing comes with risks, and there’s a chance you might not get back as much as you put in.
This document provides you with information about markets or economic events. We use publicly available information, which we believe is reliable but we haven’t verified the information so we can’t guarantee its accuracy.
This document belongs to HSBC. You shouldn’t copy, store or share any information in it unless you have written permission from us.
We’ll never share this document in a country where it’s illegal.
This document is prepared by, or on behalf of, HSBC UK Bank Plc, which is owned by HSBC Holdings plc. HSBC’s corporate address is 1 Centenary Square, Birmingham BI IHQ United Kingdom. HSBC UK is governed by the laws of England and Wales. We’re authorised by the Prudential Regulation Authority (PRA) and regulated by the Financial Conduct Authority (FCA) and the PRA. Our firm reference number is 765112 and our company registration number is 9928412.