
18 November 2024
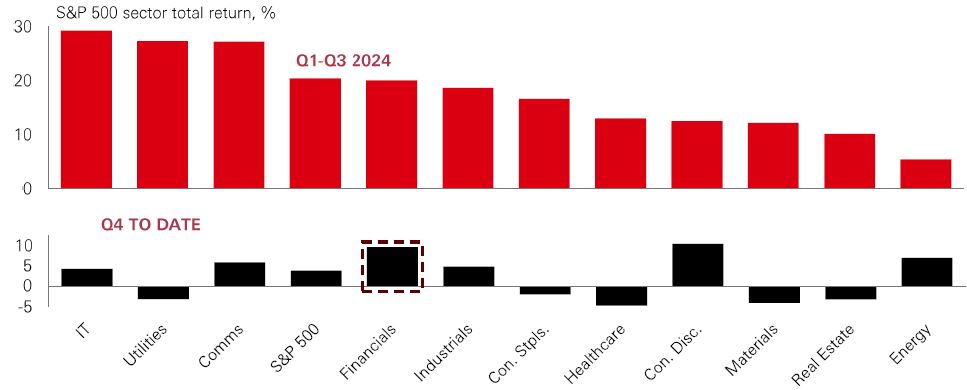
Investors remain in good spirits post-election, with US stocks steadying after previous week’s big rally. Many crypto assets are hitting new highs, and credit spreads have ground lower to record tights. Potential policy changes – in the form of lower corporate tax rates and deregulation – have given markets a fresh catalyst. Does this extend the trend of “US exceptionalism”?
Some analysts don’t think investors should give up on the broadening out trade. The US economic growth premium is still expected to shrink in 2025, and profit growth will be more evenly distributed across the globe. There is still a big valuation case for EAFE and EM stocks. That means that any better-than-expected news can be doubly good news for market performance.
But rising policy uncertainty weighs on the global outlook. What’s more likely, therefore, is broadening out at the sector and factor level. In the US, we’ve seen signs that the market is prepared to look beyond the technology sector, with financials and energy performing strongly this quarter on the prospect of a regulatory overhaul. And in an environment characterised by still-high inflation, a shallower cutting cycle, and economic expansion, neglected parts of global stock markets – such as value stocks – could catch up. In 2025, a multi-factor, multi-sector approach could work best.
After a year of dramatic moves in policy rate expectations, a possible shift towards inflationary fiscal policies in the US has once again raised the prospect of the Fed keeping rates higher for longer. One asset class that could be well placed to benefit from that is securitised credit.
Given its floating rate nature, securitised credit moves differently to other asset classes during economic cycles and offers an alternative source of risk-adjusted returns. That’s contributed to it being one of the best performing fixed income asset classes over the past two years – with 2024 expected to be another strong year.
For allocators, fixed income has historically been a natural portfolio diversifier to stocks, given their usually uncorrelated relationship. But the potential shift back to higher-for-longer rates – and greater correlation between the two assets – raises the risk of the traditional 60/40 stock/bond portfolio coming under threat again.
For securitised credit, low correlation to regular fixed income, and lower correlation to stocks than corporate bonds could make it an option for multi-asset portfolios. Given the high starting income levels and wide securitised credit spread (versus history) the mix of both factors could generate attractive total return going forwards for investors.
The value of investments and any income from them can go down as well as up and investors may not get back the amount originally invested. Past performance does not predict future returns. Investments in emerging markets are by their nature higher risk and potentially more volatile than those inherent in some established markets. The level of yield is not guaranteed and may rise or fall in the future. For informational purposes only and should not be construed as a recommendation to invest in the specific country, product, strategy, sector or security. Any views expressed were held at the time of preparation and are subject to change without notice. Any forecast, projection or target where provided is indicative only and not guaranteed in any way. Diversification does not ensure a profit or protect against loss.
Source: HSBC Asset Management. Macrobond, Bloomberg. Data as at 7.30am UK time 15 November 2024.
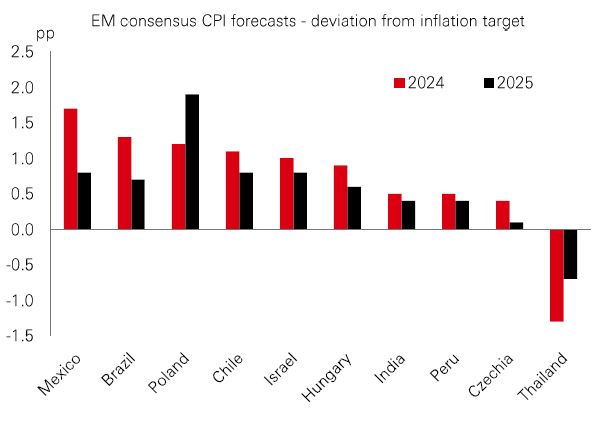
2024 has generally been a year of good news on disinflation, resilient growth, and corporate profits. Central bankers have been able to pivot policy, and the global cutting cycle has got underway. But with fiscal policy remaining active, fresh uncertainty around global trade, and geopolitical tensions creating volatility in commodity prices, market concerns about inflation are likely to linger a bit longer in 2025.
Nonetheless, consensus forecasts are for inflation rates to continue drifting lower across developed and emerging markets next year. But progress is expected to be slower in some emerging markets, and notably Latin America. Brazil, for example, was among the first to hike rates in response to post-pandemic inflation, and then led the global easing cycle. But in October, its policymakers were forced to hike rates by 0.5% to tackle resurgent inflation. Regional neighbours like Mexico and Chile have faced similar pressures. Overall, most major global economies will see inflation settle in the 2-3% range over the medium term, but regional variations should be expected. Given the idiosyncratic nature of regional economies, there could be rewards for investors prepared to do their homework.
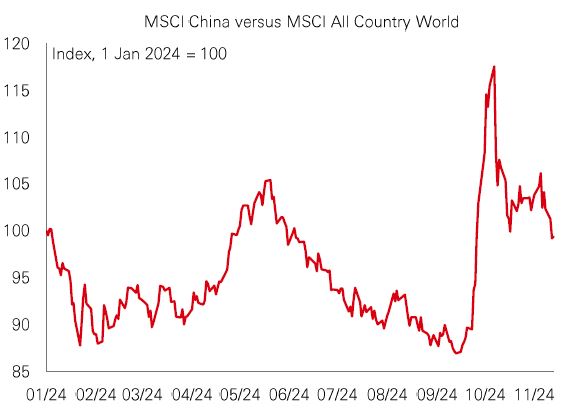
The latest round of economic support from Chinese policymakers was a disappointment for those hoping for major fiscal stimulus.
The new plan – which followed a meeting of China’s legislative body, the NPC Standing Committee – is a CNY12 trillion (USD1.7 trillion) effort to tackle longstanding local government ‘hidden’ debt, much of which involves a 3-5-year debt-swap scheme.
What investors ideally wanted was news on support for China’s property sector and consumer spending. But despite the limited direct growth boost, the debt-swap plan is still a welcome step towards repairing local government balance sheets. And it has been enough to keep Chinese stocks supported even as trade policy uncertainty has spiked.
Further fiscal stimulus planning is likely at December’s Central Economic Work Conference. More details on macroeconomic targets and policies will likely follow next March during the annual NPC meeting. Overall, Chinese policymakers will maintain a gradual approach for now, offering just enough to support investor confidence that “there is more to come”, while reserving some fiscal firepower for 2025 and beyond.
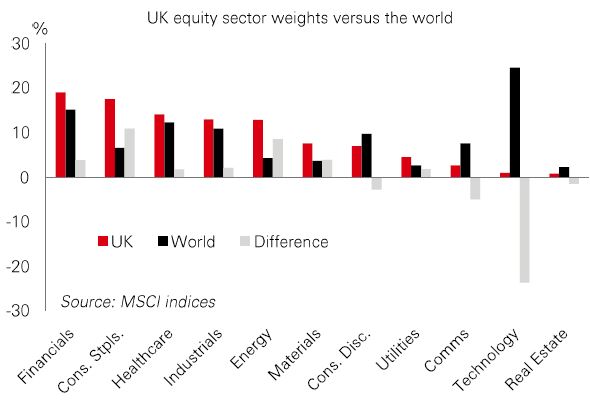
More than a decade of sluggish economic growth has contributed to a sizeable valuation discount in UK assets. Equities, for instance, trade on a modest forward price-to-earnings ratio of around 12x. The large-cap FTSE 100 index offers an average dividend yield of 4.1%, and a total shareholder yield, including buybacks, of 6%. That’s almost twice the level of the S&P 500. Even when accounting for sector differences and a large underweight to the tech sector, UK valuations look undemanding.
Research suggests that standout yield could get more appealing as interest rates fall, boding well for UK stocks. Signs of economic recovery also point to a potential opportunity for UK assets.
But there are catches. Any slowdown in global growth could hurt UK stocks. And domestic economic headwinds, the risk of more aggressive BoE policy easing, and sustained FX moves could cause volatility.
Past performance does not predict future returns. The level of yield is not guaranteed and may rise or fall in the future. For informational purposes only and should not be construed as a recommendation to invest in the specific country, product, strategy, sector or security. Any views expressed were held at the time of preparation and are subject to change without notice.
Source: HSBC Asset Management. Macrobond, Bloomberg, Datastream. Data as at 7.30am UK time 15 November 2024.
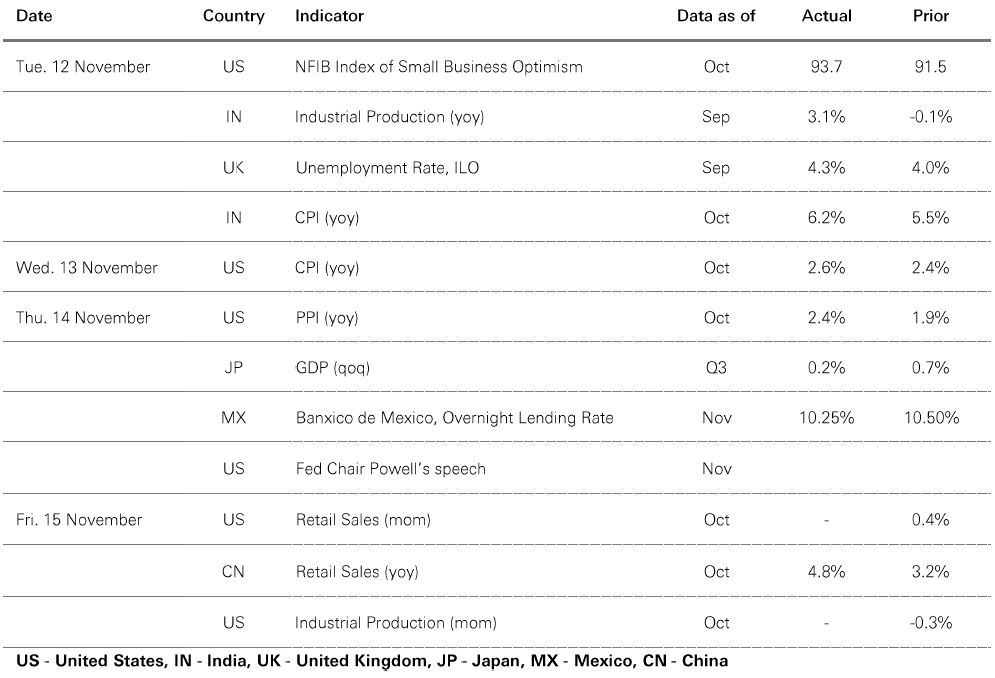
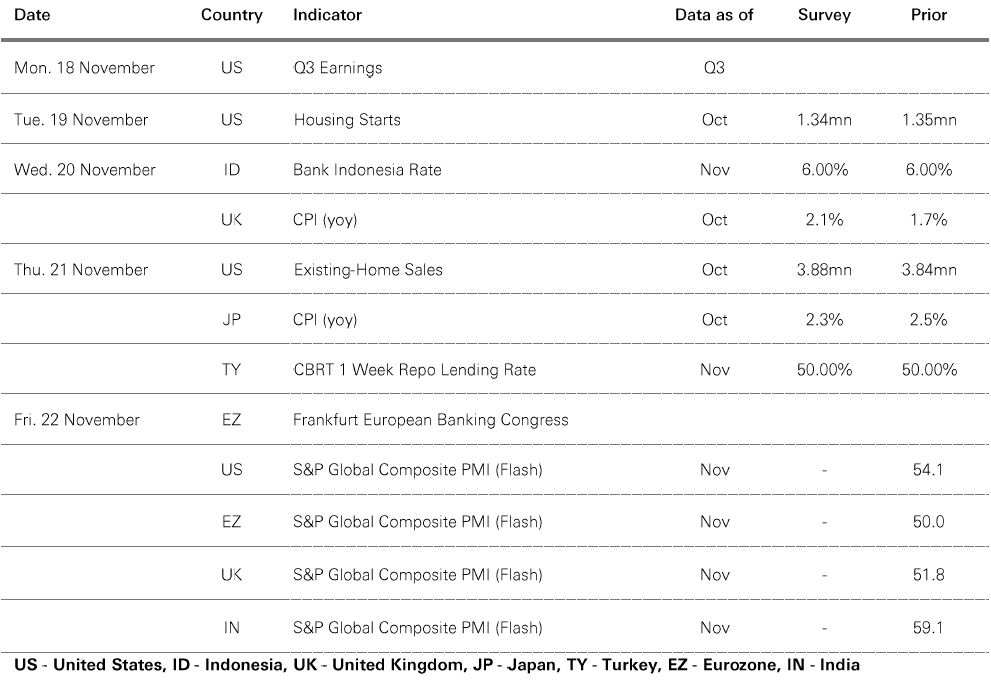
Source: HSBC Asset Management. Data as at 7.30am UK time 15 November 2024. For informational purposes only and should not be construed as a recommendation to invest in the specific country, product, strategy, sector or security. Any views expressed were held at the time of preparation and are subject to change without notice.
Risk markets were steady as investors digested the potential policy implications of the US presidential election result, with the US DXY dollar index strengthening. Core government bonds were mixed, with fiscal and inflation worries overhanging US Treasuries. US equities softened, with the rate- sensitive Russell 2000 faring worse than the S&P 500 and Nasdaq amid mixed Q3 earnings. The Euro Stoxx 50 index posted modest gains, and Japan’s Nikkei 225 weakened despite a softer yen versus the US dollar. EM equities saw widespread losses due to weakness in technology stocks, mainland China growth concerns, and ongoing geopolitical worries. The Hang Seng and South Korea’s Kospi were the main casualties. The Shanghai Composite and India’s Sensex index also weakened. In commodities, oil prices dropped amid a stronger USD and lingering oversupply concerns. Gold and copper fell.


We’re not trying to sell you any products or services, we’re just sharing information. This information isn’t tailored for you. It’s important you consider a range of factors when making investment decisions, and if you need help, speak to a financial adviser.
As with all investments, historical data shouldn’t be taken as an indication of future performance. We can’t be held responsible for any financial decisions you make because of this information. Investing comes with risks, and there’s a chance you might not get back as much as you put in.
This document provides you with information about markets or economic events. We use publicly available information, which we believe is reliable but we haven’t verified the information so we can’t guarantee its accuracy.
This document belongs to HSBC. You shouldn’t copy, store or share any information in it unless you have written permission from us.
We’ll never share this document in a country where it’s illegal.
This document is prepared by, or on behalf of, HSBC UK Bank Plc, which is owned by HSBC Holdings plc. HSBC’s corporate address is 1 Centenary Square, Birmingham BI IHQ United Kingdom. HSBC UK is governed by the laws of England and Wales. We’re authorised by the Prudential Regulation Authority (PRA) and regulated by the Financial Conduct Authority (FCA) and the PRA. Our firm reference number is 765112 and our company registration number is 9928412.