
28 October 2024
Last week’s jamboree of finance chiefs and policymakers at the annual meetings of the IMF and World Bank in Washington confirmed what many investors already know; inflation is in retreat and global growth remains impressively resilient. The soft landing is here.
For the US, UK, Japan, Southern Europe, and some Emerging Markets (EM), the IMF has upgraded its 2024 scenario. It’s a triumph for central bankers. But the challenge for investors, of course, is assessing how much of this good news on the economy is already priced in.
Heading into 2025, global growth is forecast to continue at 3.2%, adjusted for inflation. US growth is expected to be more normal, at just over 2%. Europe is projected to pick up, with the cost of living shock fading, to 1.2% in the eurozone and 1.5% in the UK. And EM economies are expected to grow at 4.2% on average – with country differences. Asia looks best placed in EM, with 2025 GDP at 5%. India is still expected to be the fastest growing major economy in the world (IMF forecasts 6.5% GDP in 2025). And frontier economies are also projected to grow strongly next year.
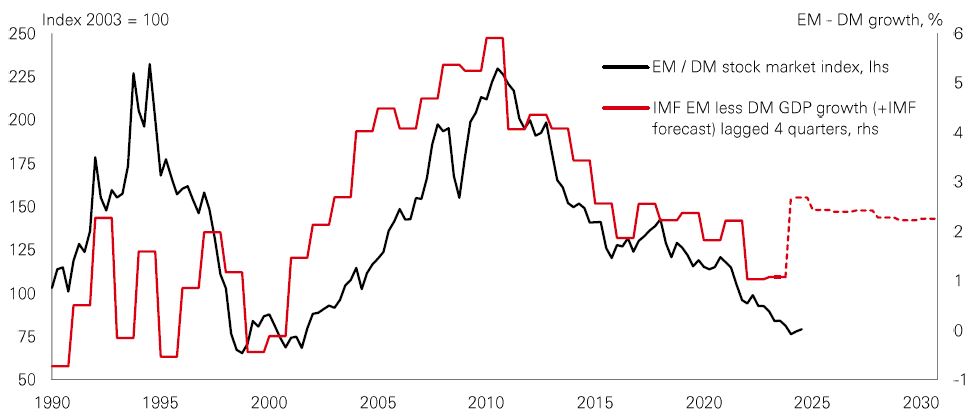
Faced with this macro scenario of the major economies drawing closer together in their growth rates, investors might well ask whether the era of “US exceptionalism” is coming to an end? Can Europe, Australasia, and the Far East (EAFE) and EMs go from being market laggards to leaders, and outperform the US?
We’ve seen a rotation in global stock markets this year, and the new analysis of September’s performance sheds light on where that’s been happening.
Quant multi-factor strategies work by weighting to ‘factors’ like Quality, Value, Momentum, Size (smaller-cap) and Low Risk. So, their performance explains a lot about changing trends in market sentiment.
This year, with so many previous winners (especially in the tech sector) still outpacing the market, Momentum has been strong. But with the Fed cutting rates in September, we saw a shake-up of factor returns during the month. The defensive Quality factor performed best, setting the pace in North America, Asia Pacific ex-Japan, and emerging markets. The market leadership is broadening out across sectors as global policy easing continues and central bankers seek to make the soft landing stick. And with the cyclical Size factor also relatively strong in North America, Europe, and EMs in September, it showed that smaller-caps are very much part of that rotation mix, too. Value ranked in the middle of factor returns globally, but it did perform well in Europe – hinting that investors are feeling more confident about looking beyond US markets for opportunities.
The value of investments and any income from them can go down as well as up and investors may not get back the amount originally invested. Past performance does not predict future returns. Investments in emerging markets are by their nature higher risk and potentially more volatile than those inherent in some established markets. The level of yield is not guaranteed and may rise or fall in the future. For informational purposes only and should not be construed as a recommendation to invest in the specific country, product, strategy, sector or security. Any views expressed were held at the time of preparation and are subject to change without notice.
Source: HSBC Asset Management. Macrobond, Bloomberg. Data as at 7.30am UK time 25 October 2024.
Nearly one-third of S&P 500 firms have reported results for Q3, with the analyst consensus looking for year-on-year earnings growth of 3.5% overall. So far, progress looks good.
Three of the top five earnings growth contributors in Q3 are expected to be Tech firms, with the other two in Healthcare. Based on results versus expectations, Tech, Real Estate, Financials, Staples, and Healthcare have all come in better than average. But Energy and Materials have been at the lower end.
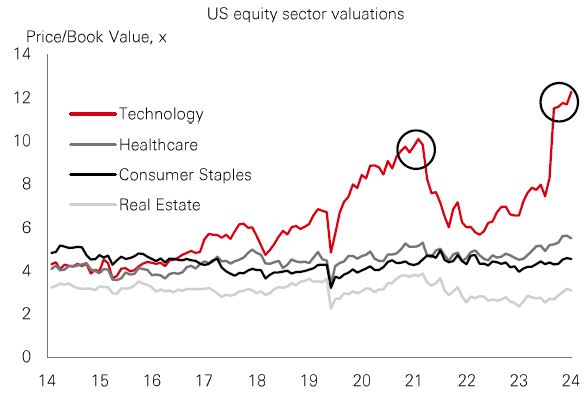
Tech companies are expected to dominate the earnings pie for several quarters to come, but a lot rests on high expectations. The S&P Tech sector currently trades on a trailing price-book value of 12.3x. That’s higher than before the sharp sector sell-off in 2021 (see chart) and surpasses its previous all-time high of 12.1x in 2000. As a comparison, Tech stocks are up by nearly 600% over the past decade, while Real Estate and Consumer Staples are up by only 40% and 60% respectively. With continuing signs of a rotation in sectors and styles, stretched Tech sector valuations demand caution.
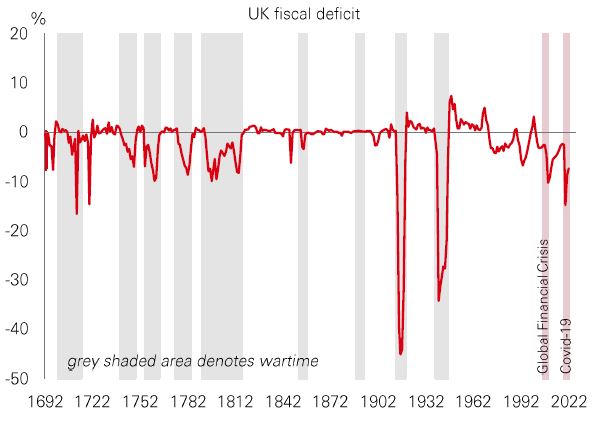
Sovereign bond investors are in a jittery mood ahead of the UK Chancellor’s inaugural Budget on 30 October. Like many developed and EM economies, the UK’s parlous fiscal position is a major challenge. The fiscal deficit is at levels usually associated with wartime, while the net debt/GDP ratio has risen to just shy of 100% in 2023, with the IMF expecting that to worsen.
Higher GDP growth would be the optimal way to fix it, but UK productivity has flatlined since the global financial crisis. Investment as a percentage of GDP has consistently lagged the US and eurozone since the early 1990s.
Major political and economic obstacles make austerity-like policies unworkable. Governments are compelled to pursue active fiscal policies to address inequality, low productivity, and population ageing. The multi-polar world and climate change also require extra spending on defence and the transition to net zero. The upshot is big deficits could be with us for a while. Despite UK inflation trending lower, gilt yields have remained stubbornly high – a signal that investors are uneasy.
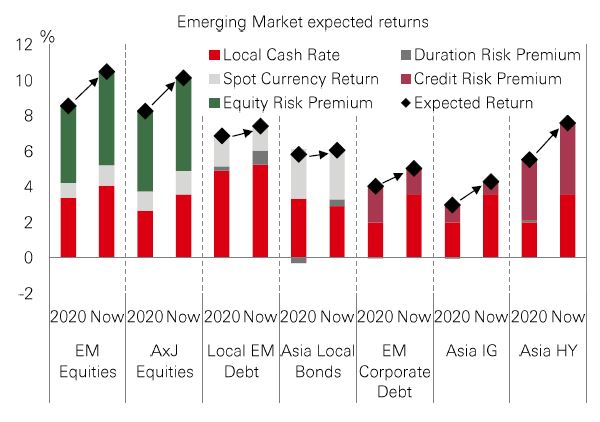
EM’s expected returns look good. The risk premia for asset classes like stocks, EM local-currency bonds, and Asia high-yield bonds are elevated because policy rates are expected to be a bit higher over the next decade. Good starting valuations mean that, over the long run, investors should be able to harvest income, or achieve capital gains.
In addition, EM currencies could boost potential returns further. The FX valuation model tracks the misalignment of current spot rates versus a fundamental valuation anchor. And it incorporates how macro fundamentals will evolve over the next decade to move FX equilibrium.
Geopolitical risks and a new multi-polar world mark a profound shift in the economic regime. But EM investors could benefit as macro trends in Asia and the Global South diverge from the West.
Past performance does not predict future returns. The level of yield is not guaranteed and may rise or fall in the future. For informational purposes only and should not be construed as a recommendation to invest in the specific country, product, strategy, sector or security. Any views expressed were held at the time of preparation and are subject to change without notice.
Source: HSBC Asset Management. Macrobond, Bloomberg, Datastream, Data as at 7.30am UK time 25 October 2024.
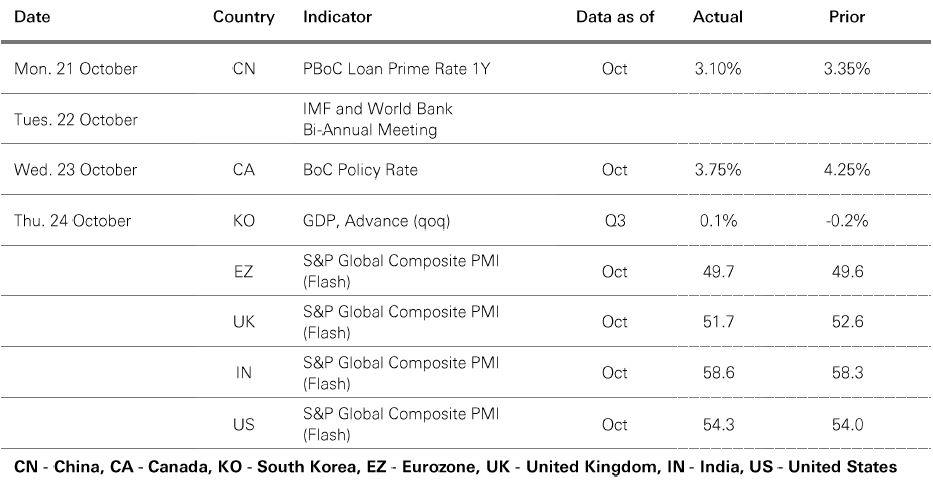
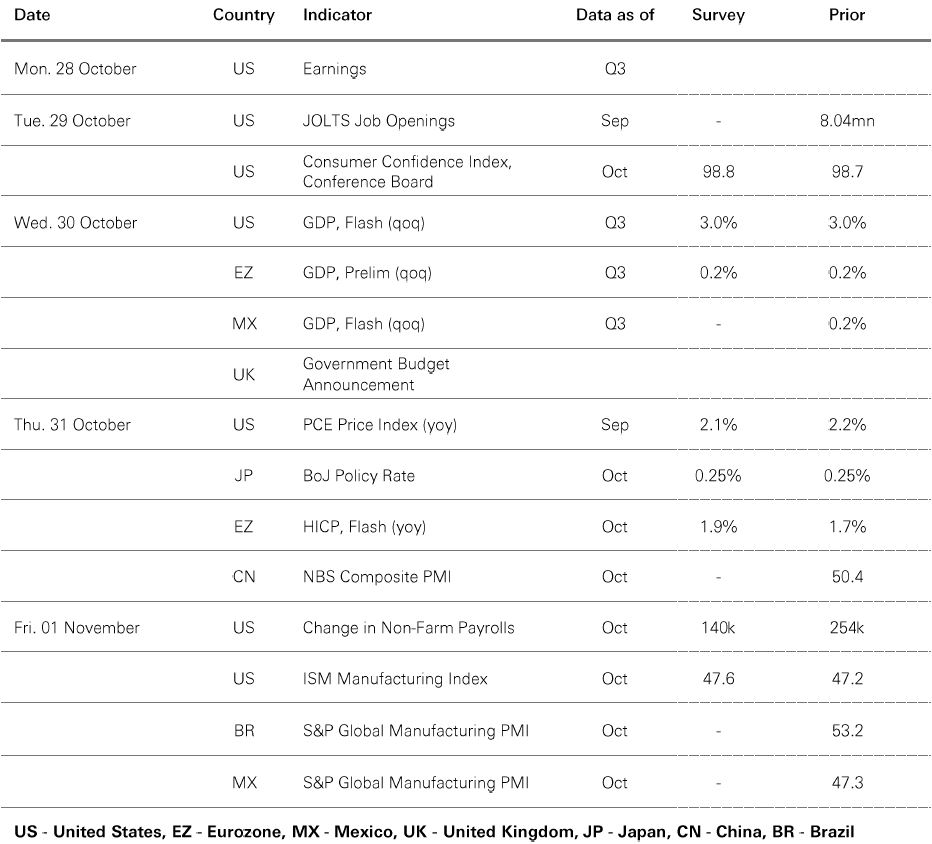
Source: HSBC Asset Management. Data as at 7.30am UK time 25 October 2024. For informational purposes only and should not be construed as a recommendation to invest in the specific country, product, strategy, sector or security. Any views expressed were held at the time of preparation and are subject to change without notice.
Global markets struck a cautious tone last week ahead of the looming US presidential election on 5 November, and key US payrolls data this week. 10-year US Treasury yields reached a three-month high of 4.26% before easing later last week, with the US dollar also rallying to a three-month high mid-week on uncertainty over the timetable for Fed rate cuts. In US stocks, both the large-cap S&P 500 and small-cap Russell 2000 declined early last week despite generally positive Q3 earnings news. The pan-European Stoxx Europe 600 fell, with Japan’s Nikkei 225 also seeing declines on political uncertainty ahead of the general election on 27 October. In emerging markets, China’s Shanghai Composite was a rare positive performer, but India’s Sensex and Korea’s Kospi indices both lost ground. In commodities, the oil price was broadly stable, and gold traded just short of record highs.


We’re not trying to sell you any products or services, we’re just sharing information. This information isn’t tailored for you. It’s important you consider a range of factors when making investment decisions, and if you need help, speak to a financial adviser.
As with all investments, historical data shouldn’t be taken as an indication of future performance. We can’t be held responsible for any financial decisions you make because of this information. Investing comes with risks, and there’s a chance you might not get back as much as you put in.
This document provides you with information about markets or economic events. We use publicly available information, which we believe is reliable but we haven’t verified the information so we can’t guarantee its accuracy.
This document belongs to HSBC. You shouldn’t copy, store or share any information in it unless you have written permission from us.
We’ll never share this document in a country where it’s illegal.
This document is prepared by, or on behalf of, HSBC UK Bank Plc, which is owned by HSBC Holdings plc. HSBC’s corporate address is 1 Centenary Square, Birmingham BI IHQ United Kingdom. HSBC UK is governed by the laws of England and Wales. We’re authorised by the Prudential Regulation Authority (PRA) and regulated by the Financial Conduct Authority (FCA) and the PRA. Our firm reference number is 765112 and our company registration number is 9928412.